Another important concept to be introduced here is the task
parallel granularity, defined as the ratio between the time a
process is making useful computations and the time it's waiting for
communication from other processes. An easy way to increase (i.e. to
coarse) the parallel granularity is decreasing the
cell size to increase the total number of grid points the process is
working on. Those concepts are further explained in Appendix
B.
In order to get a higher speedup while using the domain
decomposition in the PTidal program (Kaplan, 1997), it was
attempted to coarse the parallel granularity. The higher
granularity is achieved increasing the computation in each block by
dividing the cell size, due to the fact that the communication delay
increase with a slower rate than the computation time. We designed a
first grid (called th5 in the following) with
![]() grid points and a second, th20, using half the grid size of the
previous one and having 4 times the number of grid points (
grid points and a second, th20, using half the grid size of the
previous one and having 4 times the number of grid points (
![]() ). The test setup was further
explained in Section 7.2.1.
). The test setup was further
explained in Section 7.2.1.
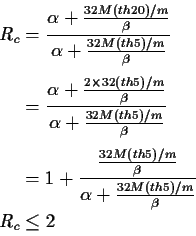
If both models use the same time step, and also a similar domain
decomposition over an
![]() mesh of processors, as in figure
5.2, the computation time,
Tcompute on
(9.1), for every time step is multiplied by 4 when we
switch from using grid th5 to th20, while the message size is
increased by a factor of 2. Considering the latency delay
mesh of processors, as in figure
5.2, the computation time,
Tcompute on
(9.1), for every time step is multiplied by 4 when we
switch from using grid th5 to th20, while the message size is
increased by a factor of 2. Considering the latency delay
![]() (defined in B.3), the communication time,
Tcommunic on (9.2), is increased by a factor smaller
than 2, Rc<2 on (9.3).
(defined in B.3), the communication time,
Tcommunic on (9.2), is increased by a factor smaller
than 2, Rc<2 on (9.3).
Where the mesh being worked on is
![]() cells, 247 is the
number of operations to build and solve the tri-diagonal matrix and
Fm is the computer performance measured in MFLOPS.
cells, 247 is the
number of operations to build and solve the tri-diagonal matrix and
Fm is the computer performance measured in MFLOPS.
Where the first 8 stands for the 8 times communication is employed,
![]() [
[![]() s] is the latency delay and
s] is the latency delay and ![]() [Mega-Bytes/s]
is the bandwidth , the second 8 stands for the 8 bytes in each
double precision number and
2(M/n+N/n) is number of values being sent.
[Mega-Bytes/s]
is the bandwidth , the second 8 stands for the 8 bytes in each
double precision number and
2(M/n+N/n) is number of values being sent.
The Rc ratio of communication for th20 in relation to mesh th5is:
In the case of a workstation's cluster the latency time explains most of the communications delay and the Rc rate is near 1. Therefore the communication delay is not significantly increased when we switch to the th20 grid and the increase in the runtime is due mainly to the computations, increasing the parallel granularity.
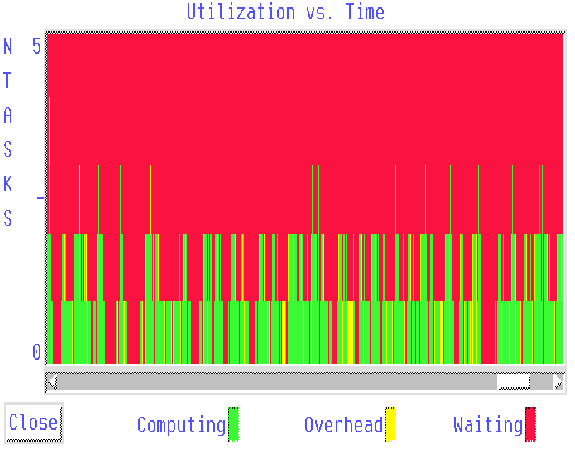
The above diagram represents run-time in the x axis and number of processes in the y axis, (4 slaves plus 1 master). The optimum is to have 4 processes working simultaneously, in green (gray in the b&w version). Red (black) represents wasted process time waiting for communication and Yellow (light gray) means overhead, useless time as well.
Working with the coarser granularity mesh the utilization parameter is increased and a higher speedup is obtained. Compare the numerically obtained utilization diagrams for the th5 grid (figure 9.1) and for the coarser parallel grain th80 grid (figure 10.1). On those diagrams is clearly verified the better utilization value in the th80 grid simulation from the larger green area.
The use of higher resolutions is the way of getting more accurate approximations when CFD restrictions apply. The increased speedup associated to the parallel grain coarsening is an indirect positive result of this grid refinement.
![\begin{displaymath}
T_{compute}(m \times n)= 247 \frac{M/m \; N/n}{F_m} \qquad [\mu s]
\end{displaymath}](img191.gif)
![\begin{displaymath}
T_{communic}(m \times n)=8 \quad (\alpha + \frac {8\times2(M/m+N/n)}{\beta}) \qquad [\mu s]
\end{displaymath}](img193.gif)