The location of a distribution of a statistical variable can usually be
presented by a single number. Mostly the arithmetic mean is
used. Suppose, we have ![]() measurements
(
measurements
(![]() numbers denoted by
numbers denoted by
![]() ), e.g. values of grades
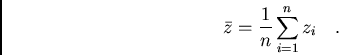
of copper. Then the arithmetic mean is
), e.g. values of grades
of copper. Then the arithmetic mean is
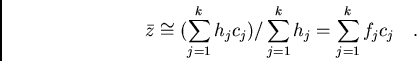
In case of classified data (as in a histogram) we can find
![]() faster via the frequencies. Denote the mean value of a class
((max-min)/2) by
faster via the frequencies. Denote the mean value of a class
((max-min)/2) by
![]() , the corresponding absolute frequency by
, the corresponding absolute frequency by ![]() and the
relative frequency by
and the
relative frequency by ![]() . If there are
. If there are ![]() classes then
classes then ![]() is approximately
is approximately
Because the arithmetic mean is equivalent to the center of gravity of
the distribution, it is also very sensitive to outliers, values which
are very far from the mass of data (gross errors). A more realistic
location parameter, which represents the ``center'' of the distribution,
is the median. We denote it by
![]() , and it is a value which splits the data set into two equal
parts: At most 50% of the values are smaller and at most 50% are
larger. In frequency tables and in stem and leaf displays,
, and it is a value which splits the data set into two equal
parts: At most 50% of the values are smaller and at most 50% are
larger. In frequency tables and in stem and leaf displays,
![]() is simply found by counting or by taking the value with the
highest depth, in cumulative frequency
polygons at the
is simply found by counting or by taking the value with the
highest depth, in cumulative frequency
polygons at the ![]() -value where the
-value where the ![]() -value reaches 50%.
-value reaches 50%.
Other location parameters are the mode (the most probable value), the mean of the range, etc.
Remark: If we interpret a statistical variable ![]() as a random
variable, which is-as mentioned in Chapter 1-a mapping of
elementary events at (a subset of) real numbers, we name the (weighted)
mean of all possible values (mathematical) expectation
as a random
variable, which is-as mentioned in Chapter 1-a mapping of
elementary events at (a subset of) real numbers, we name the (weighted)
mean of all possible values (mathematical) expectation
![]() and define it formally with the help of the density function
and define it formally with the help of the density function ![]() (ev. relative frequency) by
(ev. relative frequency) by