In a given direction ![]() , the variogram may become stable beyond some
distance
, the variogram may become stable beyond some
distance
![]() called the range,
cf. Figure 1.3.
Beyond this distance
called the range,
cf. Figure 1.3.
Beyond this distance ![]() , the
mean square deviation between two quantities
, the
mean square deviation between two quantities ![]() and
and
![]() no longer
depends on the distance
no longer
depends on the distance
![]() between them and the
two quantities are no
longer correlated. The range
between them and the
two quantities are no
longer correlated. The range ![]() gives a precise meaning to the intuitive
concept of the zone of influence of a sample
gives a precise meaning to the intuitive
concept of the zone of influence of a sample ![]() . However, there is no
reason for the range to be the same in all directions
. However, there is no
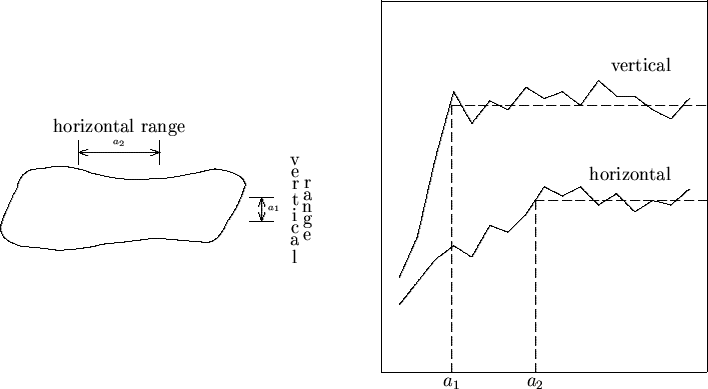
reason for the range to be the same in all directions ![]() of the space. In Figure
1.3, for instance, the vertical range characterizing the mean vertical
dimension of the mineralized lenses differs from the horizontal ranges. For
a given distance
of the space. In Figure
1.3, for instance, the vertical range characterizing the mean vertical
dimension of the mineralized lenses differs from the horizontal ranges. For
a given distance
![]() , the horizontal variogram
presents a weaker variability
than the vertical variogram: this expresses the horizontal sedimentary
character of the phenomenon considered.
, the horizontal variogram
presents a weaker variability
than the vertical variogram: this expresses the horizontal sedimentary
character of the phenomenon considered.